
If your product sells into more than one country, geographic coverage is one of the first vendor claims you will need to test, and one of the easiest to get wrong. Almost every B2B data provider describes its coverage as global. Very few mean the same thing by that word, and the distance between the claim and the reality is where product teams lose months of work.
This is the second article in the SpringDB Data Buyer Guide series. The first article covered vendor specialty, the question of what each provider does best. This one covers geography, the question of where a provider is genuinely strong. The goal is not to tell you which vendor to choose. The goal is to give you a framework for reading coverage claims accurately, so you can match a provider to the regions your product actually serves.
01 · What Global Usually Means
The Word Global Is Doing a Lot of Work
When a data provider says it offers global coverage, that statement is almost always true in a narrow sense and misleading in a practical one. Most providers built their earliest and deepest data assets in the markets where their first customers were, which for the B2B data industry has historically meant the United States and, to a lesser extent, Western Europe. Coverage then thins out across the rest of the world. A provider can hold hundreds of millions of records and still have most of them concentrated in a small number of countries.
This is not a flaw unique to any one vendor. It is a structural feature of how B2B data gets collected. Records accumulate where commercial activity, public filings, professional networks, and digital footprints are densest and most accessible. Regions with less digitized business infrastructure, stricter data protection regimes, or lower provider investment tend to end up with sparser, older, or less complete records. The headline word global rarely communicates any of that.
02 · Data Density by Region
One Coverage Number Hides Enormous Variance
A single global coverage figure is an average, and averages conceal the variance that matters most to a product team. Consider a provider that reports very high coverage in the United States and much lower coverage in a large market such as Brazil or Indonesia. If your product sells primarily into North America, that provider may be an excellent fit. If your product sells into Latin America or Southeast Asia, the same provider could leave large parts of your addressable market invisible. The average tells you almost nothing about your specific situation.
A single global average can hide steep regional drop off
Illustrative pattern of how coverage tends to fall across regions. Not any single vendor's data.
The right question is never what is the global average. It is what is the coverage in the specific countries my product sells into.
Coverage is also more than a count of records. A region can have a high record count and still be weak on the dimensions that decide whether the data is usable. Completeness measures how many fields are populated per record. Freshness measures how recently each record was verified or updated. Accuracy measures how often the data matches reality. A provider might hold many records for a given country while leaving key fields empty, or while refreshing those records far less often than it refreshes its domestic data. Density without completeness and freshness is not real coverage.
03 · What Coverage Footprints Look Like
The Same Country, Very Different Universes
Coverage claims become concrete when you look at how much of the same market different providers actually hold. Take the United States alone. Some providers deliberately focus on a curated set of established companies. Others set out to capture the entire commercial universe, down to one-person businesses that operate out of a home address. Still others prioritize the widest possible global count. These are different answers to the same question, which is what to cover in the first place.
Three providers, three different definitions of coverage
Figures reflect each provider's stated company coverage. US and global counts measure different universes.
5x5 Data ~15M United StatesA curated set of established United States companies for firmographic coverage. | BrightQuery ~72M United States & GlobalThe full United States commercial universe, reaching down to one-person home businesses and defunct companies, plus international records. | Bureau van Dijk 420M+ GlobalA worldwide aggregator focused on breadth across companies in many countries. |
Different footprints, not a ranking. A larger universe is not automatically the right universe. The correct footprint is the one that matches the customers your product is built to serve.
None of these is a better dataset than the others. A product that needs to reach sole proprietors and micro-businesses will find a curated set of larger firms almost useless, while a product that sells only to mid-market and enterprise accounts will pay for breadth it never touches. The only way to know is to measure each provider's coverage against your own definition of the market.
04 · Global Breadth vs Domestic Depth
Two Coverage Strategies, Not Two Winners
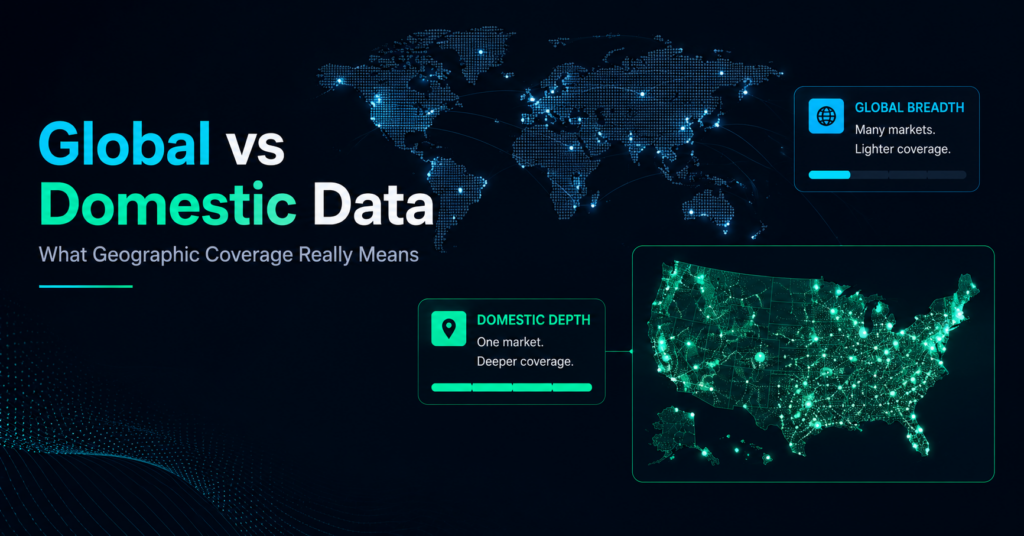
Providers also sit somewhere on a spectrum between global breadth and domestic depth. Breadth-oriented providers try to cover as many countries as possible, which is valuable when your product needs at least some presence in many markets at once. Depth-oriented providers concentrate on one country or region and go deeper there than any generalist, which is valuable when your product lives or dies on the quality of data in a single market. Neither strategy is better in the abstract.
The breadth and depth trade off
Most providers optimize toward one end. Your market decides which end serves you.
| Domestic depth, one market covered thoroughly | Global breadth, many markets covered lightly |
A pattern SpringDB sees frequently is a team that signs a broad global provider because the coverage map looks complete, then discovers that the depth in its two or three most important markets is thinner than a specialist would have offered. The reverse also happens. A team commits to a strong domestic provider, then expands internationally and finds it has to source and stitch additional regional data under time pressure. The way to avoid both outcomes is to define your geographic priorities before you evaluate providers, not after. Know which countries are essential, which are secondary, and which you can afford to leave for a later phase.
05 · When No Vendor Has the Data
Sometimes the Data Does Not Exist Yet
There is a scenario the coverage maps never mention. Sometimes no vendor has the data you need, in any region, at any price, because the data has never been assembled. This is most common in emerging markets and in specialized verticals where the underlying information was never digitized. SpringDB has worked on projects where this was exactly the constraint. In one, a platform company needed practice and physician contact information across emerging markets in Asia and Africa. That information was not online and no commercial provider held it. The only path forward was to engage firms that would manually curate the data from the ground up. On that project we worked with Span Global Services and Digital DI Consultants to build the dataset that no catalog contained.
When the catalog comes back empty
How an absence of coverage can become a proprietary advantage.
STEP 01 No vendor holds it The data was never digitized, so no commercial provider can license it at any price. | › | STEP 02 Commission curation Specialist firms build the dataset from the ground up, verifying records by hand. | › | STEP 03 Own a moat The result is a proprietary asset no competitor can buy off the shelf. |
Why this matters
Manual curation costs more and takes longer than licensing an existing dataset. In return, it can produce something far more valuable than convenience. When you commission data that no one else has, you are not renting a commodity that every competitor can also license. You are building a proprietary asset, and in several cases that data becomes a genuine competitive moat, precisely because no other product in the market can source it. When your evaluation of every vendor comes back empty, that absence is not always a dead end. Sometimes it is the most defensible opportunity you have.
Not sure whether a dataset even exists for the markets you serve?
Check with a Data Exchange match analysis06 · Regional Privacy and Compliance
Coverage Carries Compliance With It
Geographic coverage is not only a data quality question. It is a legal one. Different regions govern the collection, storage, and use of personal and business data under different frameworks, and they do not align neatly with one another.
Every region you cover brings its own rulebook
A sample of the major regimes a global dataset can touch.
GDPR European Union | CCPA & CPRA California | DPDP Act India | LGPD Brazil | PIPL China |
When you embed a provider's data inside your product, you inherit that provider's compliance posture in every region where you operate. A provider that collects and processes data cleanly in the United States may carry real exposure in Europe, or the reverse. The more countries your product touches, the heavier that inherited responsibility becomes. Geographic coverage and regulatory compliance are the same conversation viewed from two angles, and both belong in your evaluation before a contract is signed. The governance dimension is covered in depth later in this series.
07 · How to Evaluate a Coverage Claim
What to Ask Before You Trust the Map
A coverage claim is only as good as the evidence behind it. Before you accept a provider's global label, work through the following:
| ✓ | Ask for coverage broken down by country, not a single global figure. The country-level view is the only one that maps to your addressable market. |
| ✓ | Request regional match rates against your own target regions, ideally tested on a sample of your real records rather than the provider's curated demo set. |
| ✓ | Compare completeness and freshness region by region, since a record count alone can hide empty fields and stale data. |
| ✓ | Confirm how often each region is refreshed, because domestic data is often updated far more frequently than international data. |
| ✓ | Understand how the data is collected in each region, since collection method drives both quality and compliance exposure. |
None of these questions require the provider to reveal anything proprietary. A provider that is confident in its international coverage will answer them readily. A provider that resists country-level detail is telling you something useful about where its real strengths lie.
SpringDB · Data Exchange
Match Coverage to the Markets You Actually Serve
Geographic fit is one of the most common reasons a data partnership succeeds or fails, and it is rarely visible from a headline coverage number. The SpringDB Data Exchange starts from the regions your product serves and works backward to the providers with genuine depth in those markets, including the cases where the right answer is a domestic specialist stitched with a broader global source, or where the honest answer is that the data will need to be built.
Request a Data Exchange match analysis